| |
Impedance of series RLC circuits
Scroll to the bottom of the page to view applet
Background
This applet illustrates the physics of resonance in series RLC circuits in an interactive manner. The physical setup is a series circuits made up of a capacitor of capacitance C, an inductor of inductance L, a resistor of resistance R, and a source of alternating voltage. The circuit is shown below:
The frequency of the alternating voltage and current is f. The corresponding angular velocity is ω = 2πf. Voltage and current are sinusoidal functions of time and are represented graphically by the horizontal component of a rotating arrow called a phasor. In practice, phasors are drawn as fixed arrows, corresponding to a snapshot of the rotating phasor at some arbitrary point in time. The advantage of the phasor representation is that it gives a graphical representation of the relative phases and magnitudes of various sinusoidal functions.
It can be shown that:
- For the resistor:
The ratio of the r.m.s value of voltage across the resistor to the r.m.s value of current through the resistor is R. Another result is that voltage and current are in phase. If current is represented by a phasor along the positive x-axis, the phasor for voltage is along the positive x-axis as well.
- For the capacitor:
The ratio of the r.m.s value of voltage across the capacitor to the r.m.s value of current through the capacitor is: 
This ratio is the reactance of the capacitor at that frequency. Another result is that current leads voltage by a quarter of a cycle. If current is represented by a phasor along the positive x-axis, the phasor for voltage is along the negative y-axis.
- For the inductor:
The ratio of the r.m.s value of voltage across the inductor to the r.m.s value of current through the indictor is:

This ratio is the reactance of the inductor at that frequency. Another result is that the voltage leads current by a quarter of a cycle. If current is represented by a phasor along the positive x-axis, the phasor for voltage is along the positive y-axis.
By application of Kichhoff's current law, the current is the same throughout the circuit.
By application of Kichhoff's voltage law, the voltage across the source is equal to the sum of the individual voltages. The phasor for the voltage across the source is represented by the vector sum of the phasors for the individual voltages across the resistor, the capacitor, and the inductor.
The ratio of the r.m.s values of voltage and current for the whole circuit is Z, the impedance of the circuit. One can think of resistance as the part of impedance that does dissipate energy and one can think of reactance as the part of impedance that does not dissipate energy. Impedance is a measure of the ratio of the r.m.s value or voltage required to have a unit r.m.s value of current.
A simple application of the Pythagorian theorem gives : 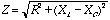
Resonance happens at a frequency of :  At that frequency, we have the following :
- The reactances of the capacitor and inductor are equal
- The impedance of the circuit is equal to R
- The volage applied by the souce is in phase with the current
- The current is maximum for given values of C,L, and R
- The power dissipated in the circuit is maximum for given values of C,L, and R
- Impedance is minimum for given values of C,L, and R
Using the applet
All the controls are located at the bottom of the applet. The controls include four sliders and a series of three radio buttons. The sliders allow the user to set the values of R, C, L and f. The voltage amplitude is equal to 1 volt. The radio buttons allow the user to choose which graph the applet will display. The user can choose one of the following four graphs :
- A graph showing the variations of current through the circuit as a function of frequency. The graph corresponds to the values of R, C, and L chosen by the user. The value of the frequency set on the slider is indicated by a vertical line.
- A graph showing the variations of the phase difference between current and voltage - or argument of the complex impedance of the circuit - as a function of frequency. The graph correspond to the values of R, C, and L chosen by the user. The value of the frequency set on the slider is indicated by a vertical line.
- A graph of voltage and current as a function of time.
- A graph showing the impedance as a function of frequency. The graph corresponds to the values of R, C, and L chosen by the user. The value of the frequency set on the slider is indicated by a vertical line. This graph also displays Xl and Xc and illustrates the fact that at frequencies much lower than the resonant frequency the circuit is mostly capacitive (Z is close to Xc, a hyperbolic function of f), that at frequencies much higher than the resonant frequency the circuit is mostly inductive (Z is close to Xl, proportional to f), and that at resonance Xl = Xc. The color code for the three curves is the same as the color code for the phasors.
In addition to these graphs, the applet displays the phasor diagram for the circuit.
|